
Release Notes Sprint 10 (Oct 26th 2022)
The new features for this sprint are the following:
Prototyped features:
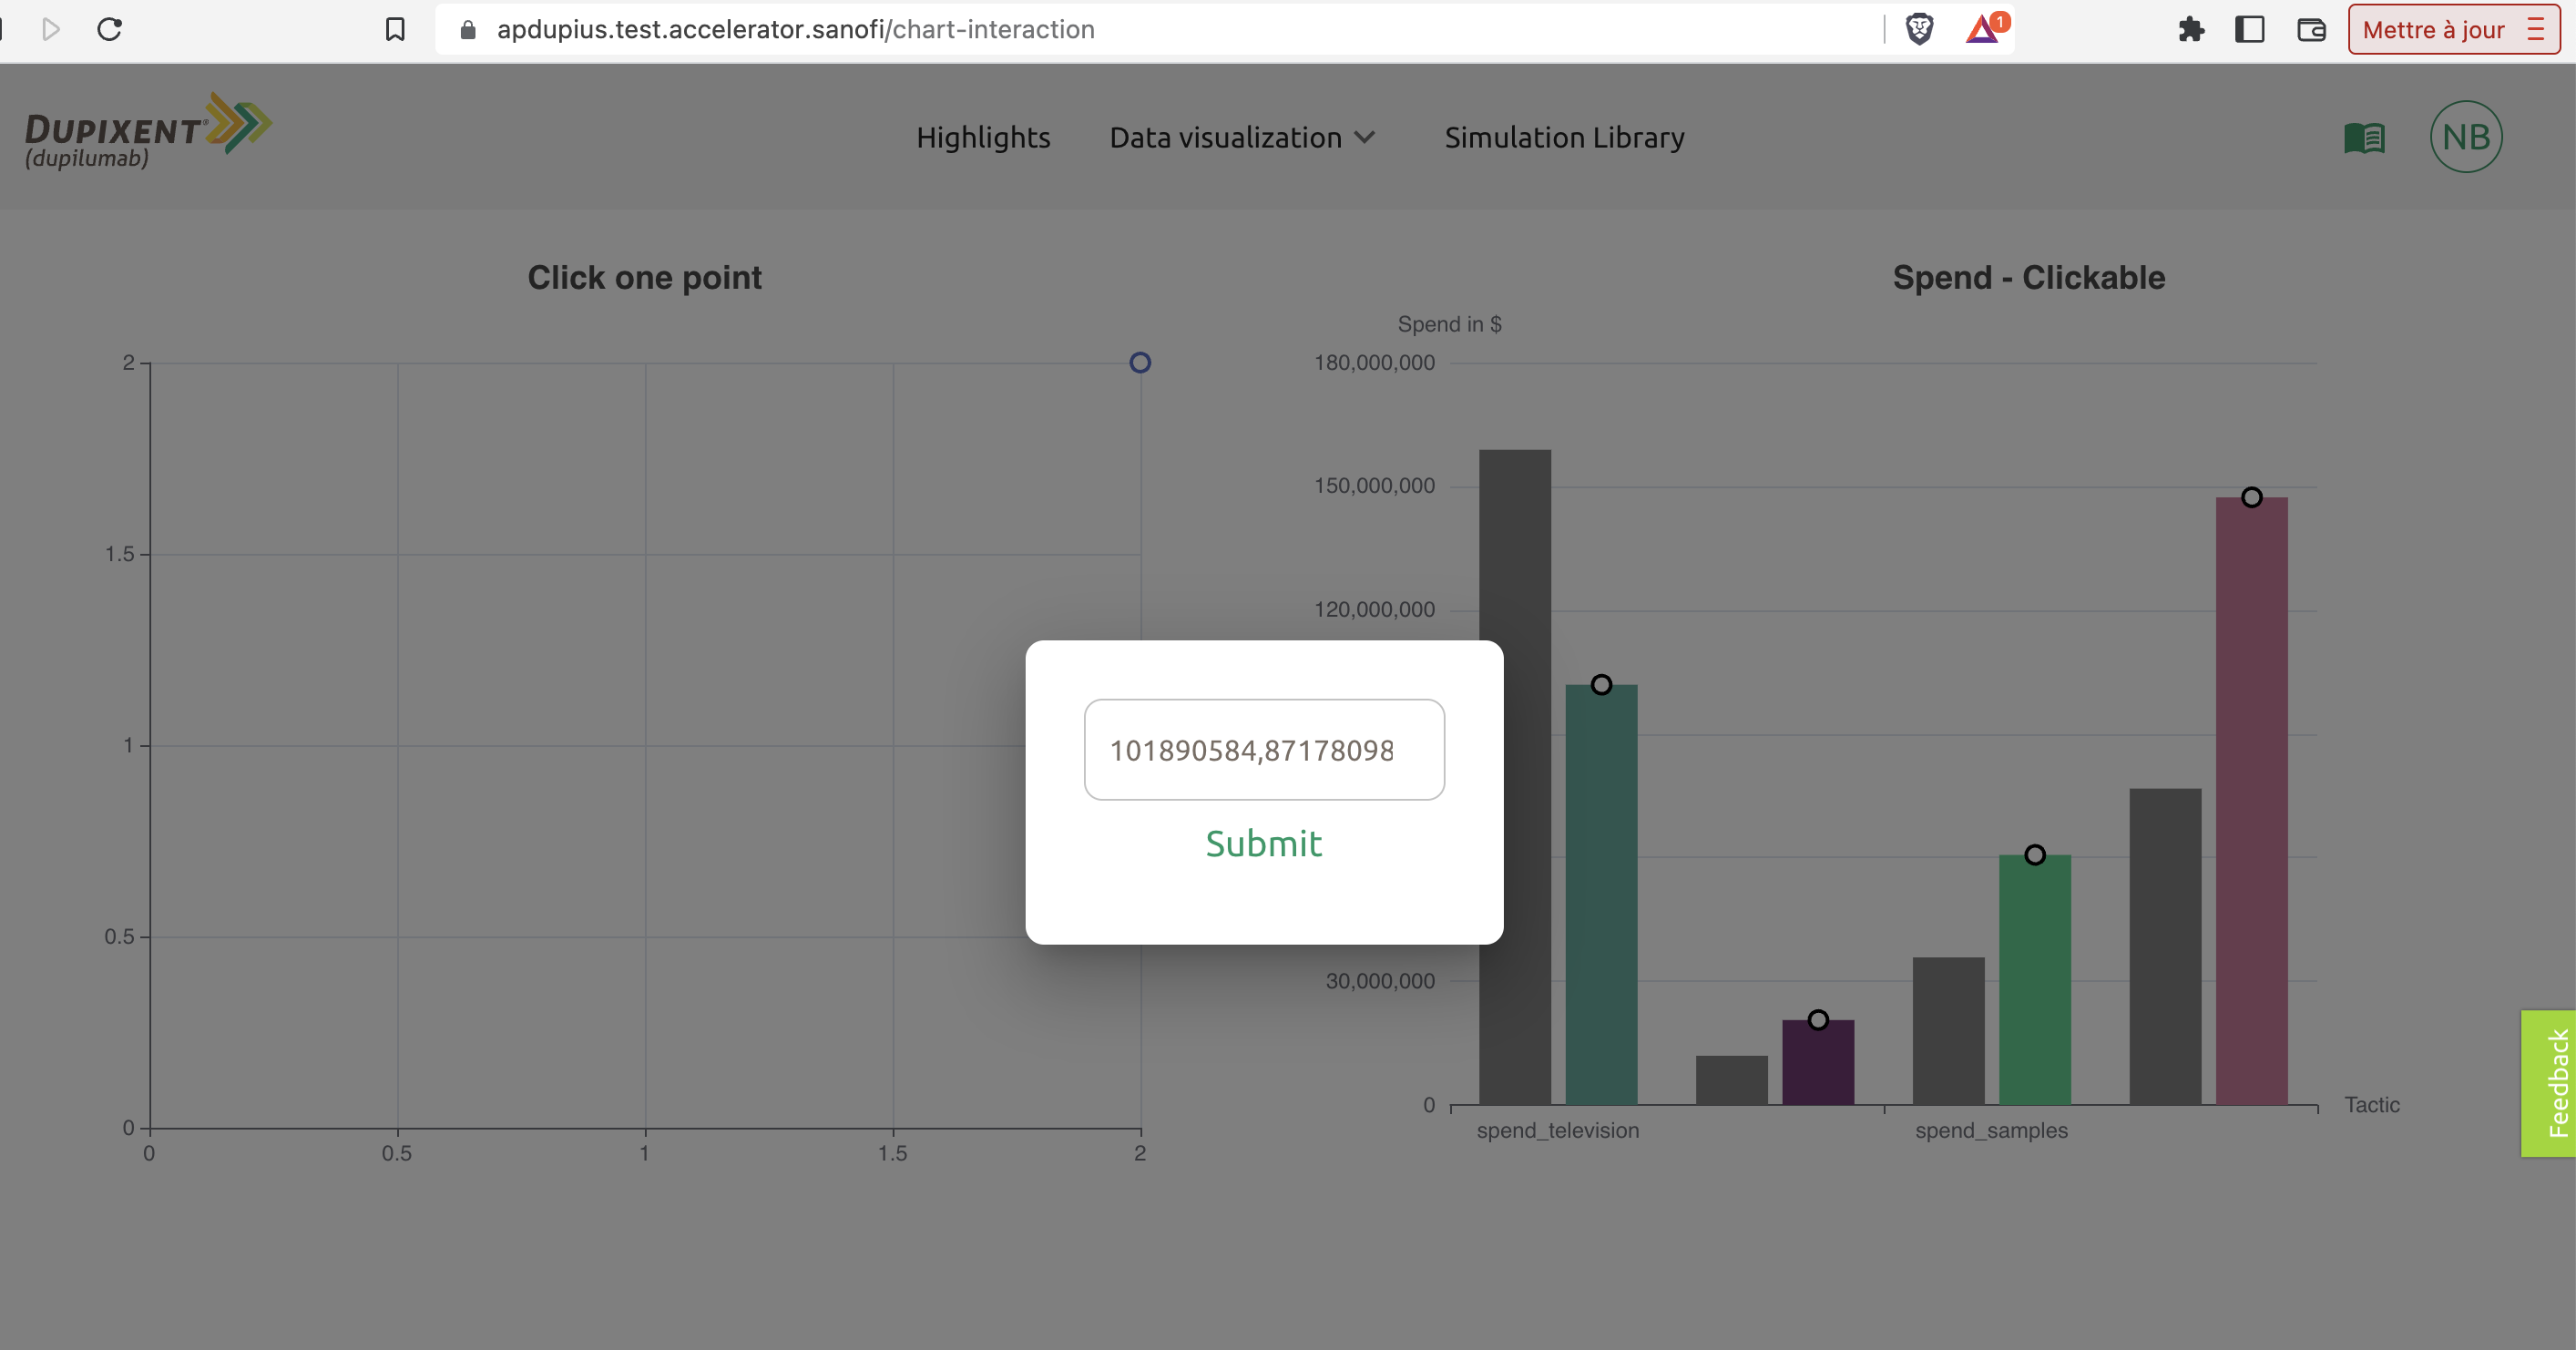
- Interacting with a data visualization: click on a point to change a value from a pop-in
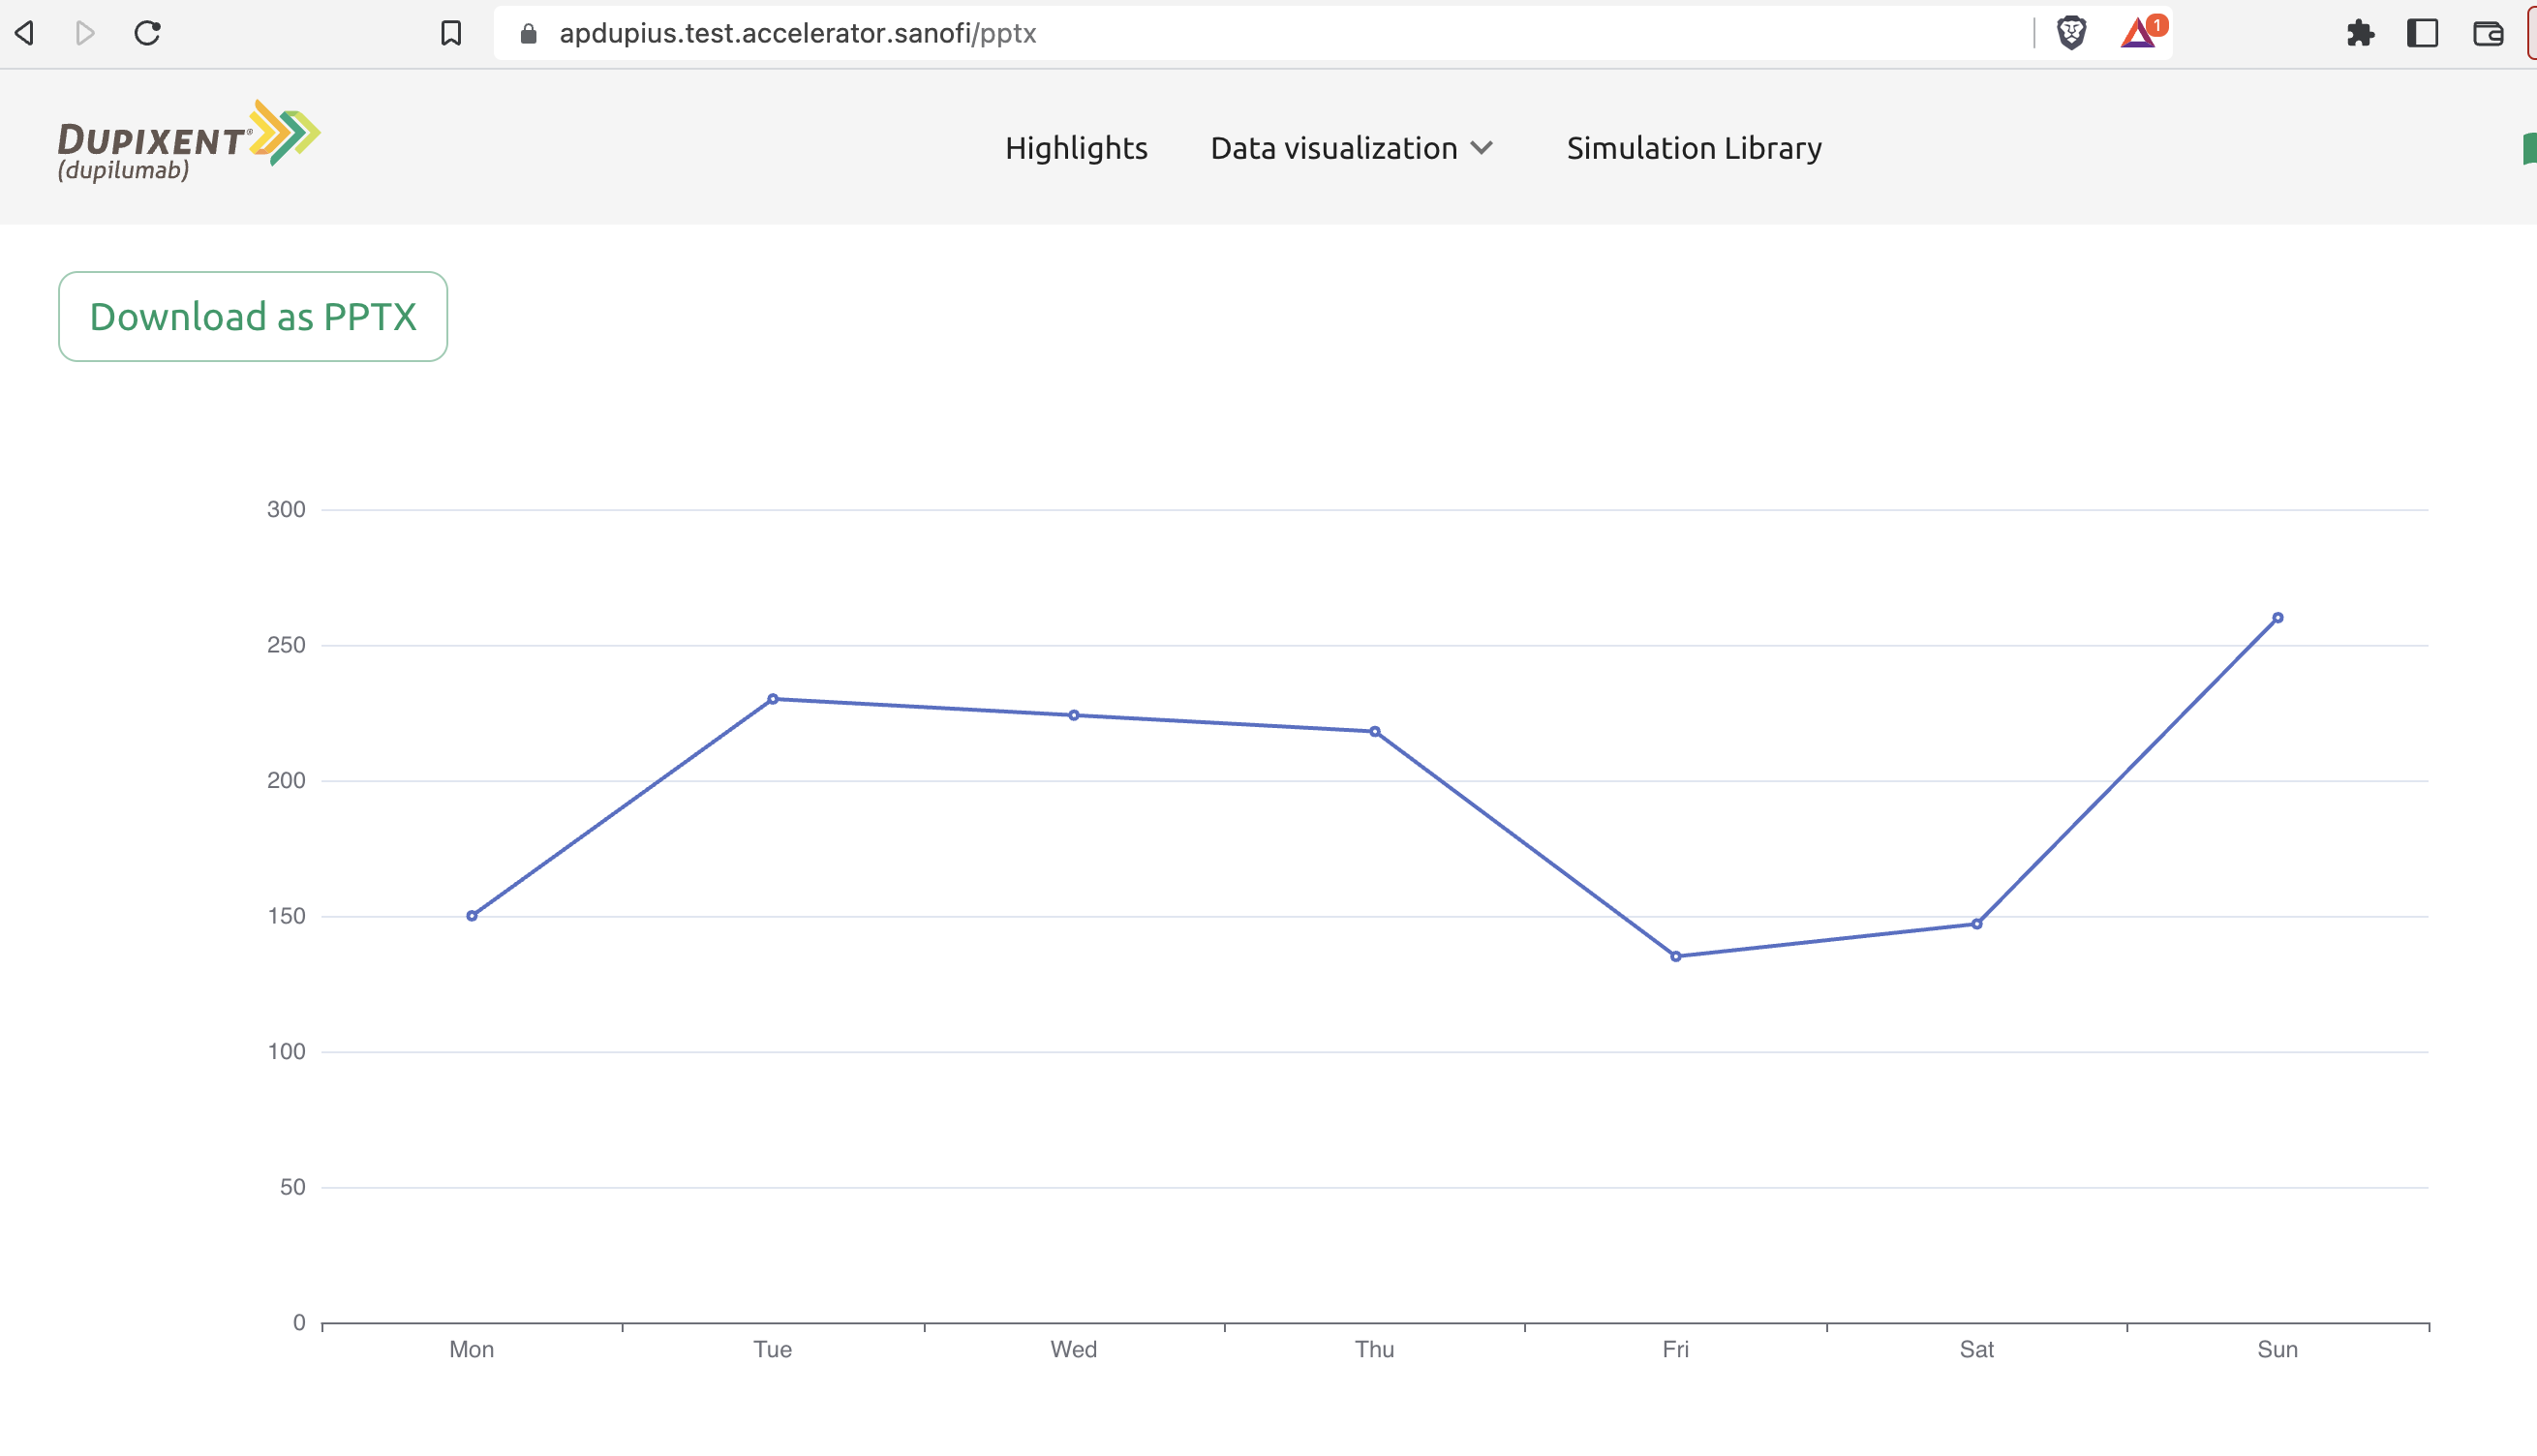
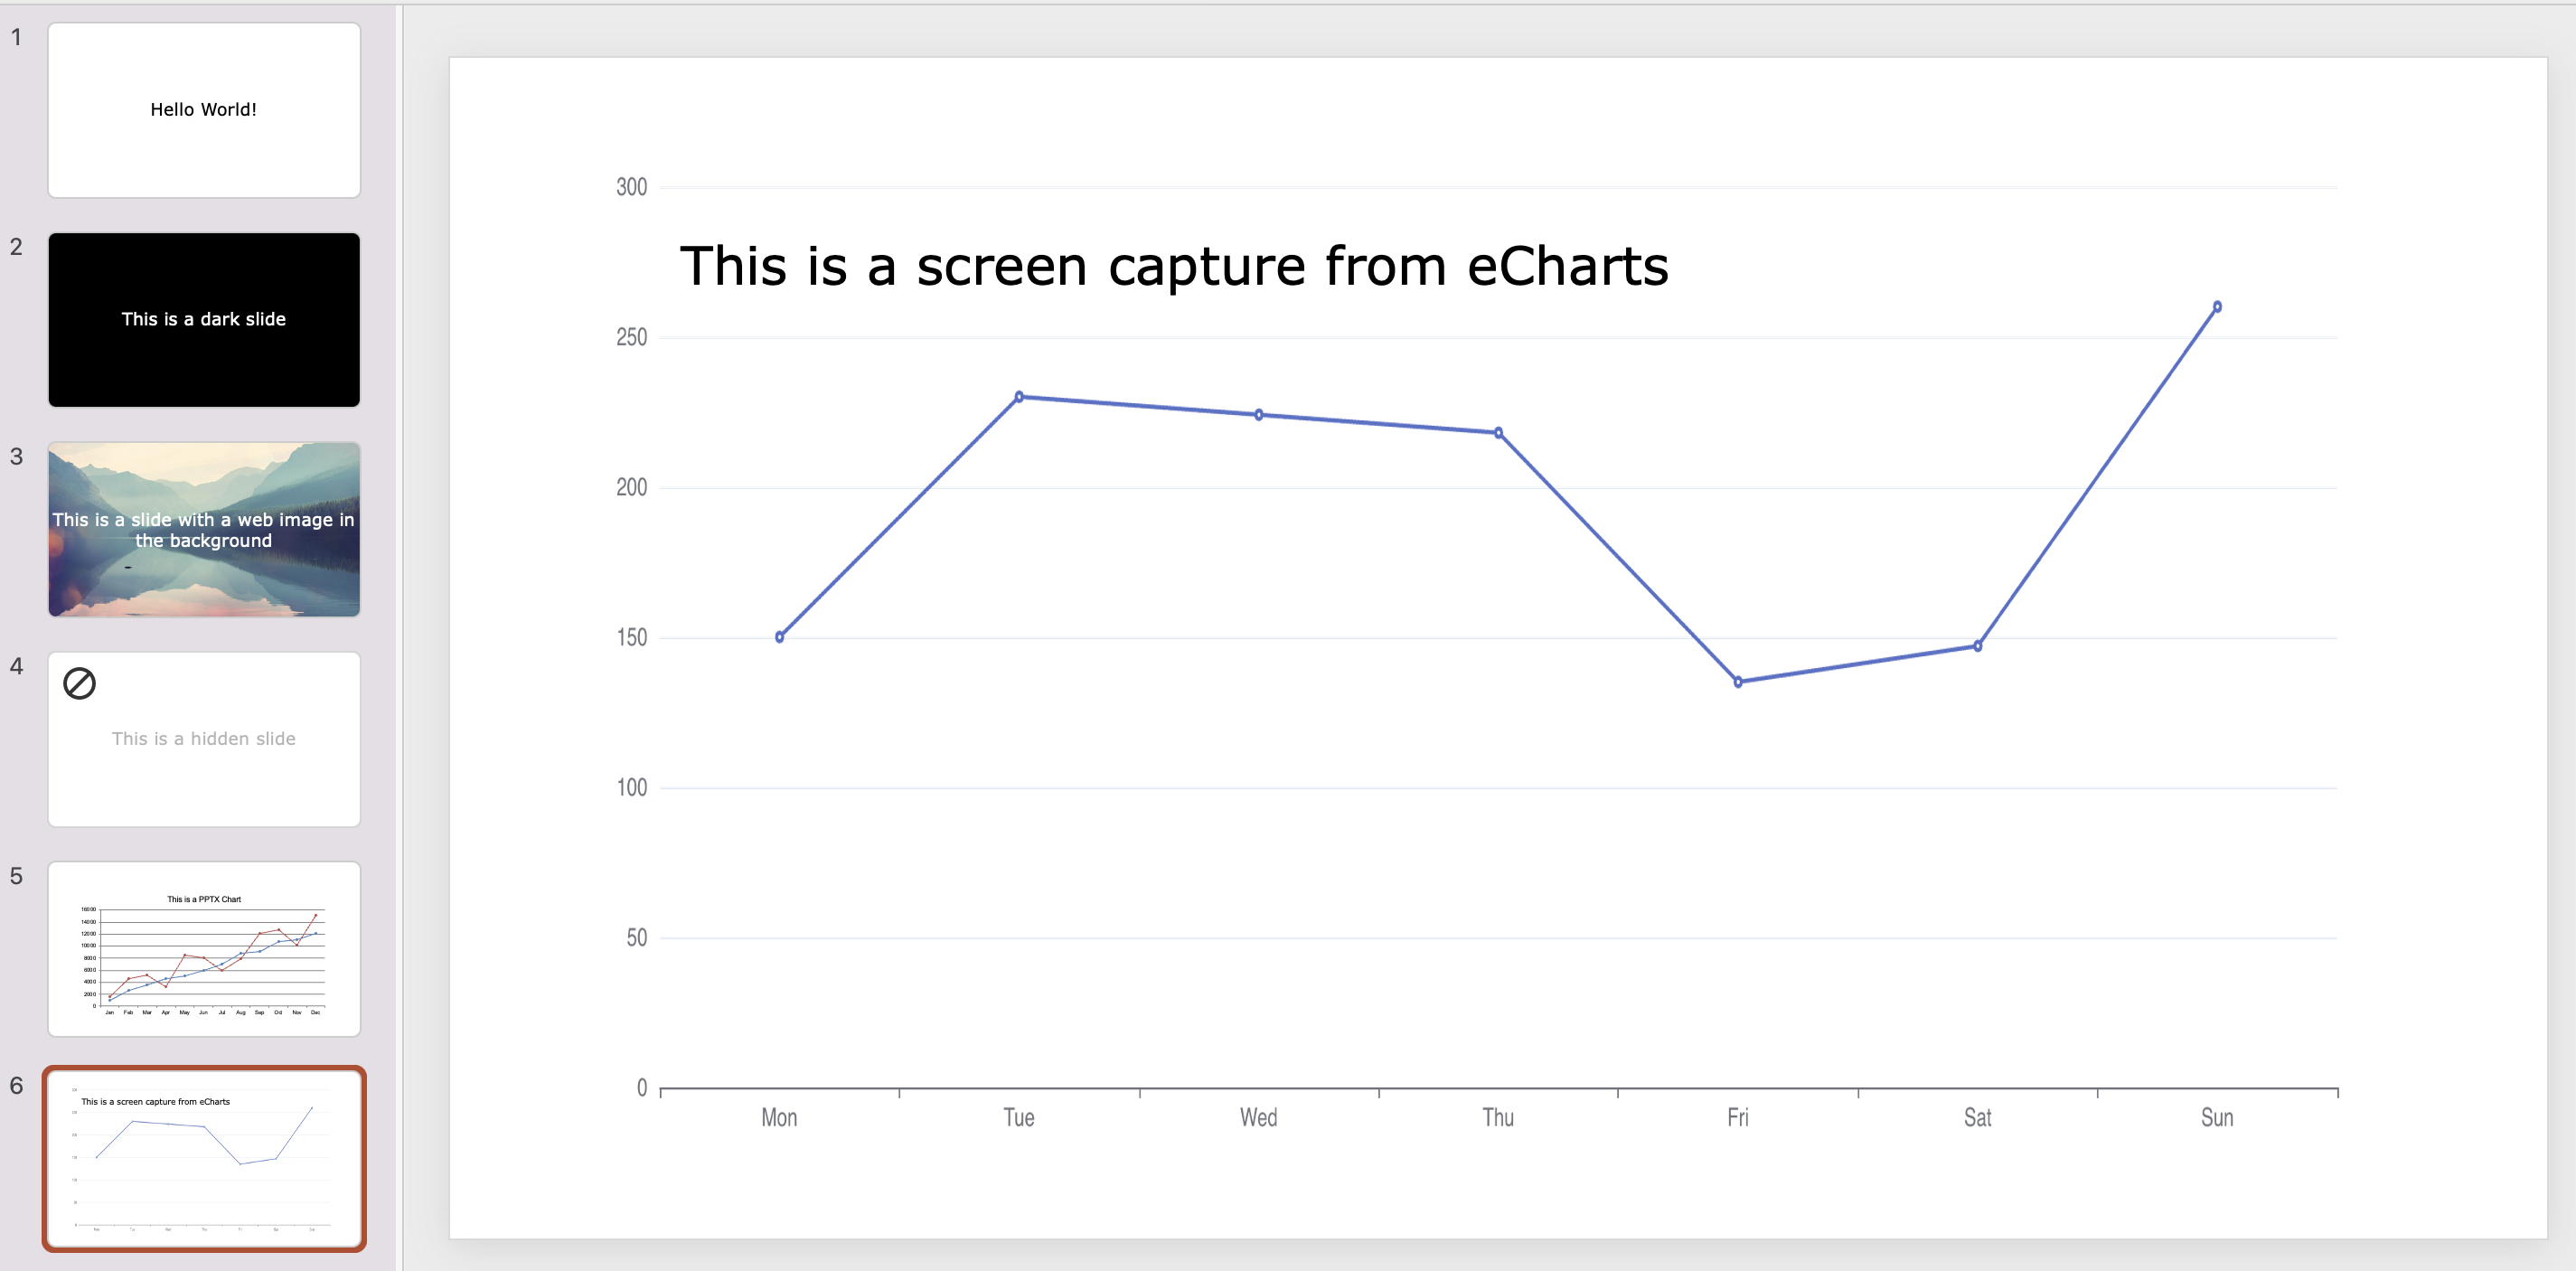
- Downloading a powerpoint that includes various slides, such as a copy paste from a data visualization from our tool, or feeding raw data to a powerpoint graph
New features:
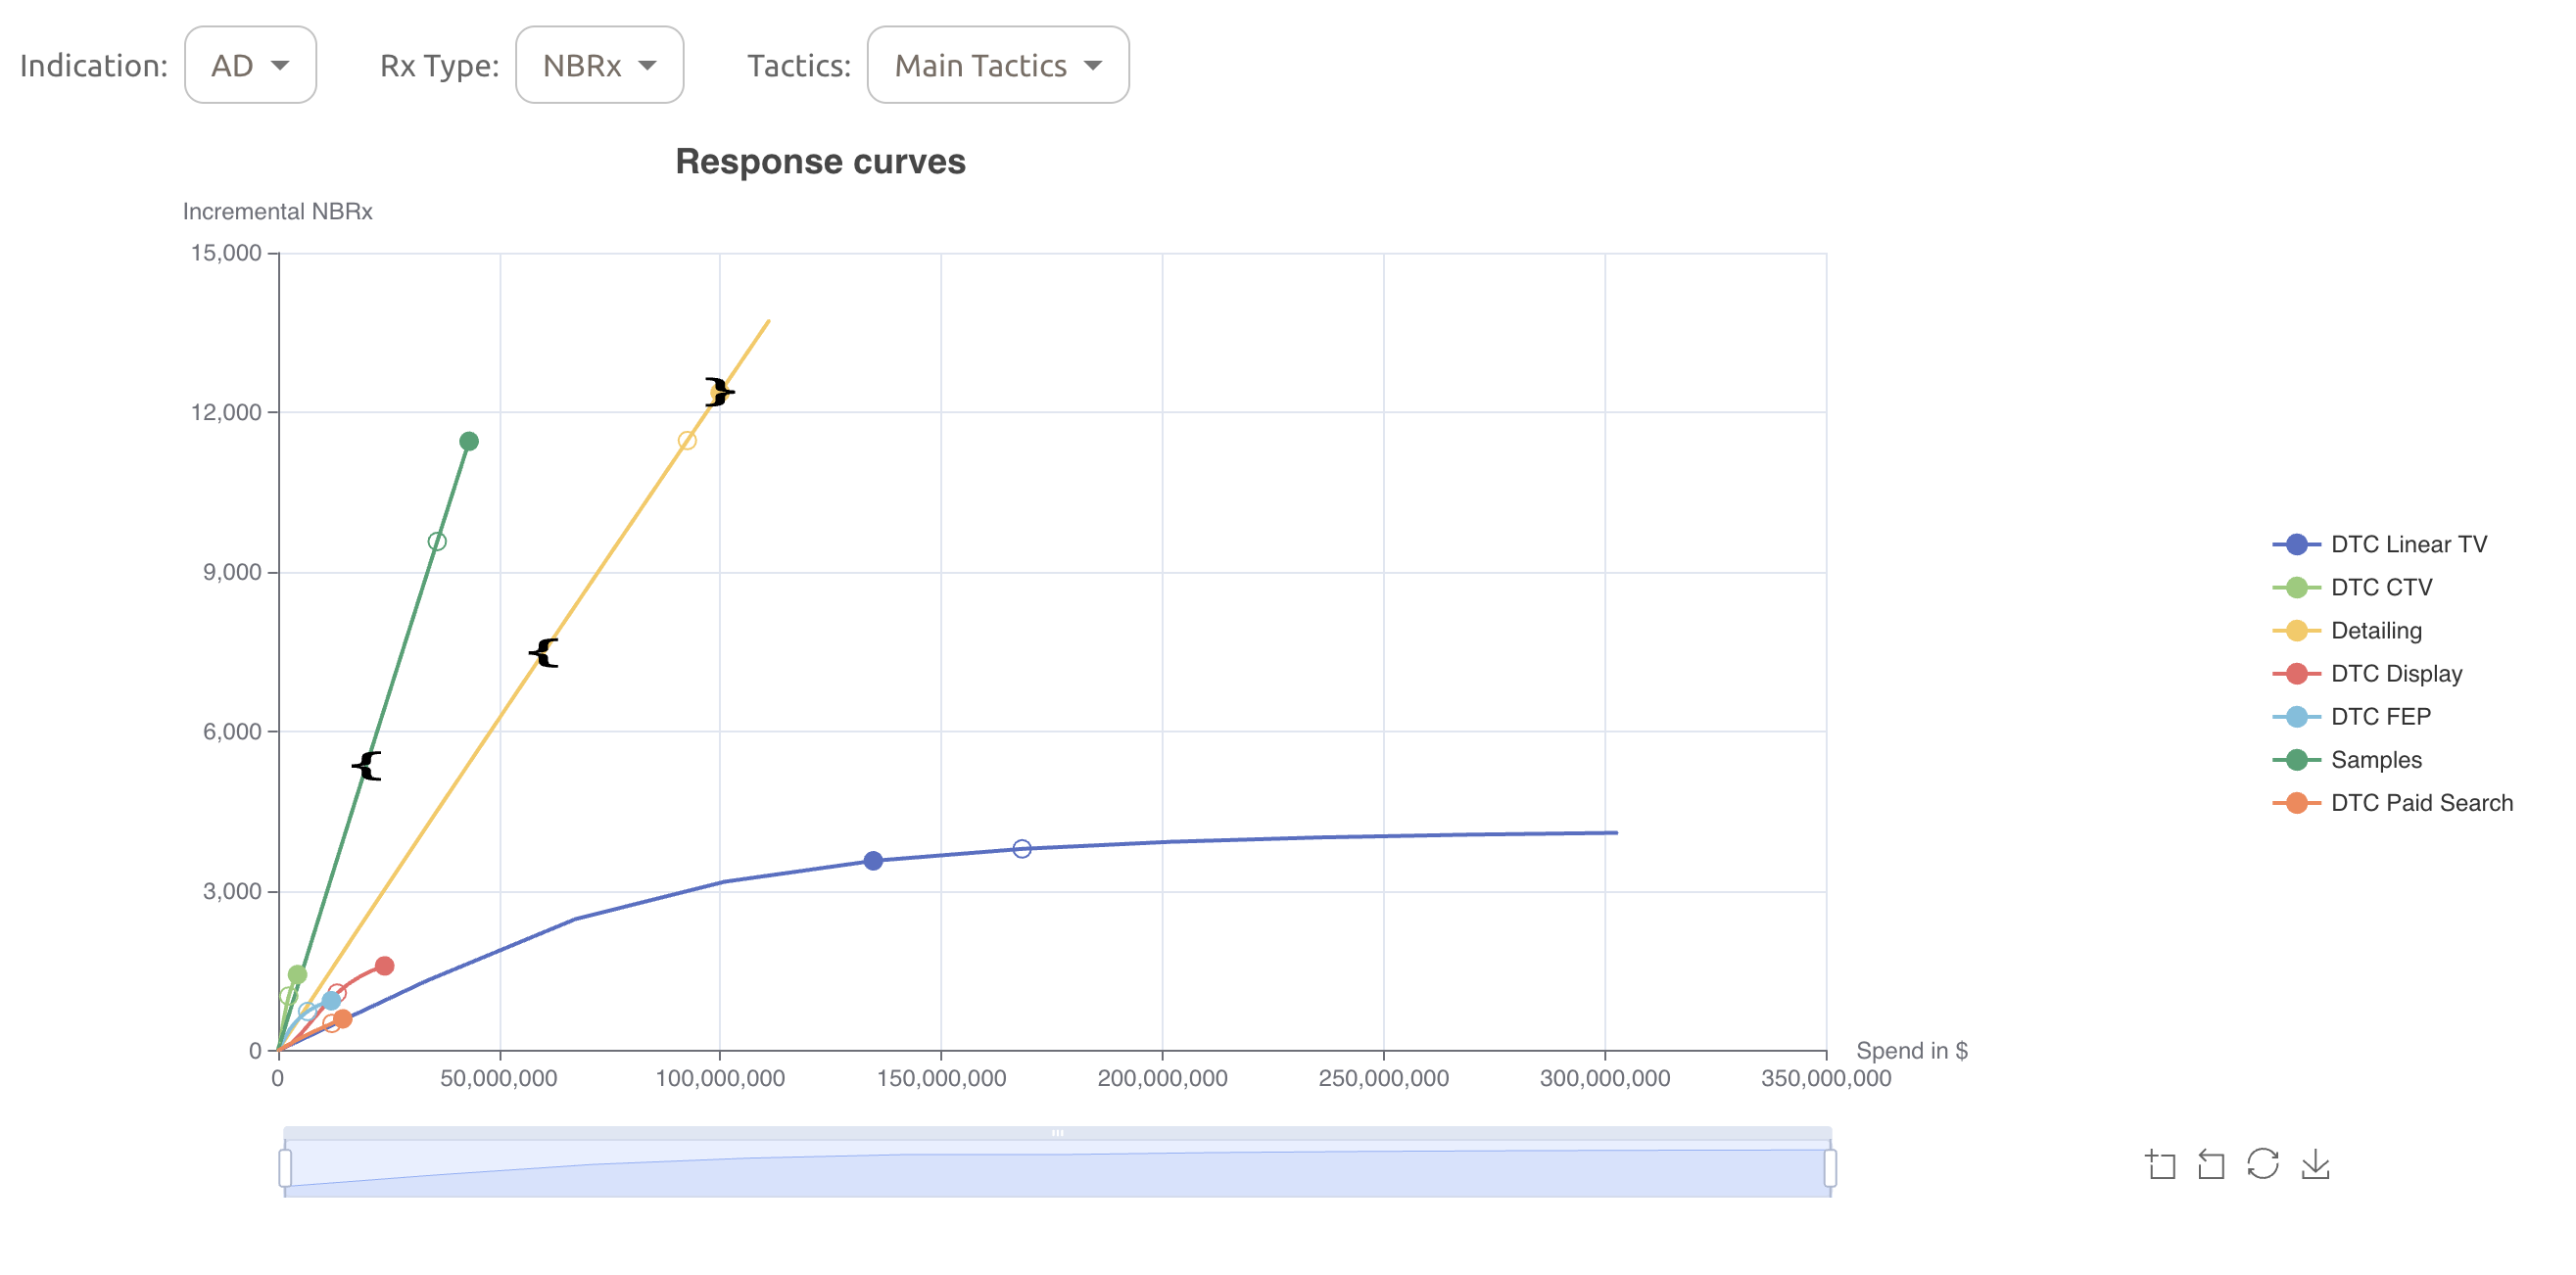
- Historical Response Curves now have Total Revenue as an option for the Y axis
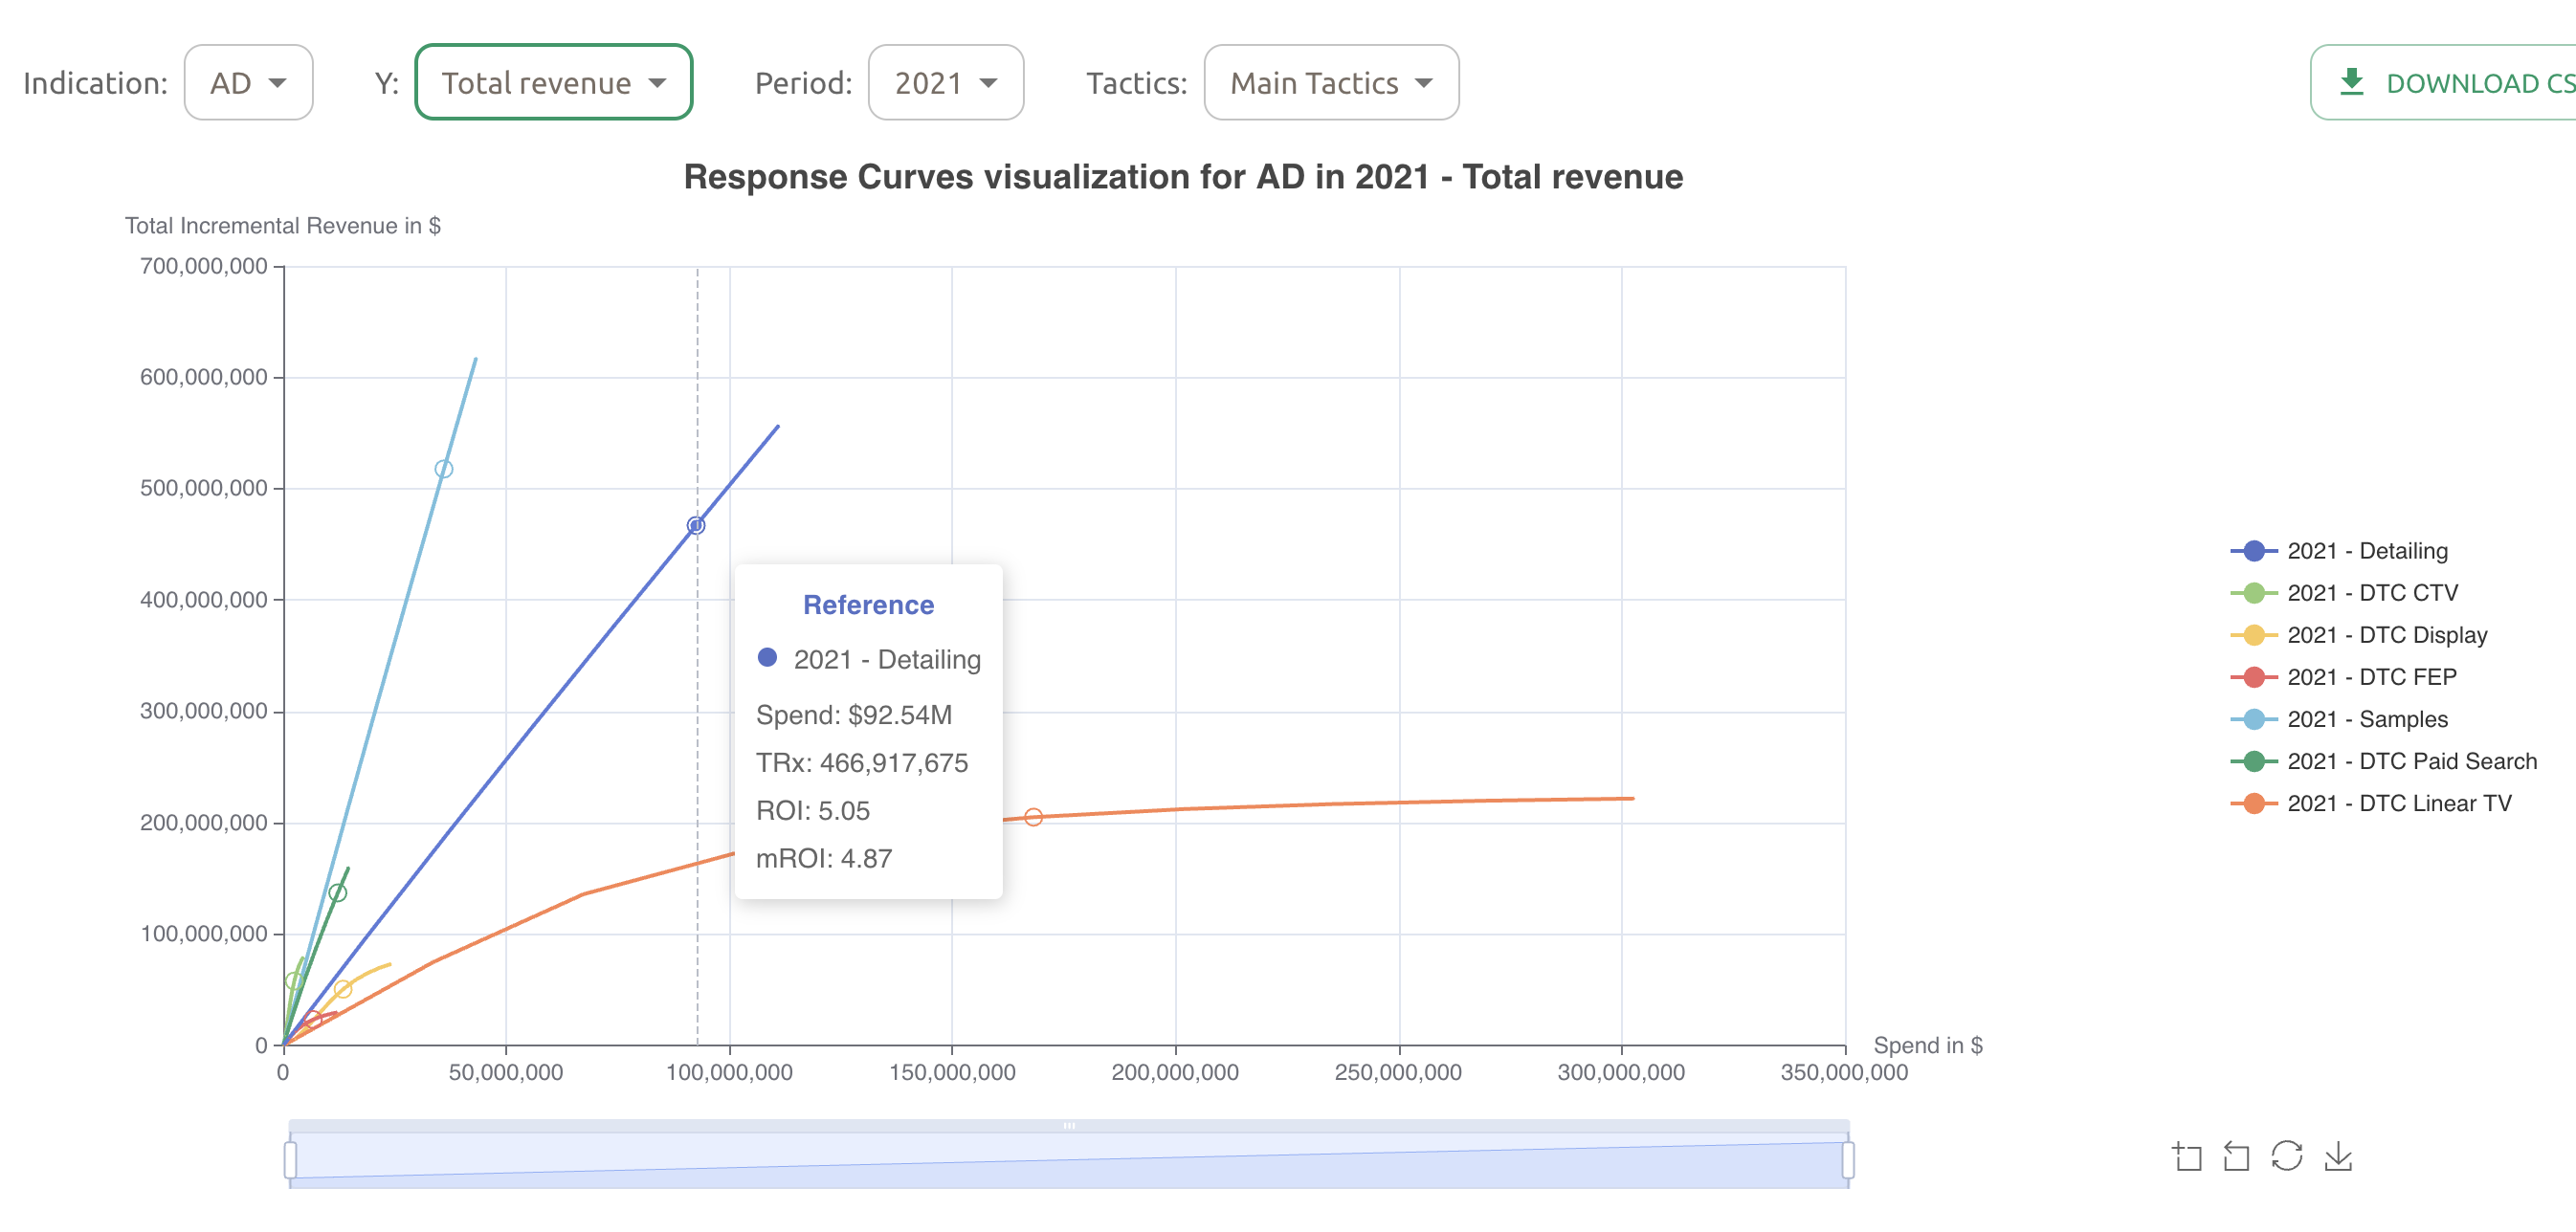
- If constraints are set on a tactic then they are visualized on the response curves (improved design will come later)
Improvements
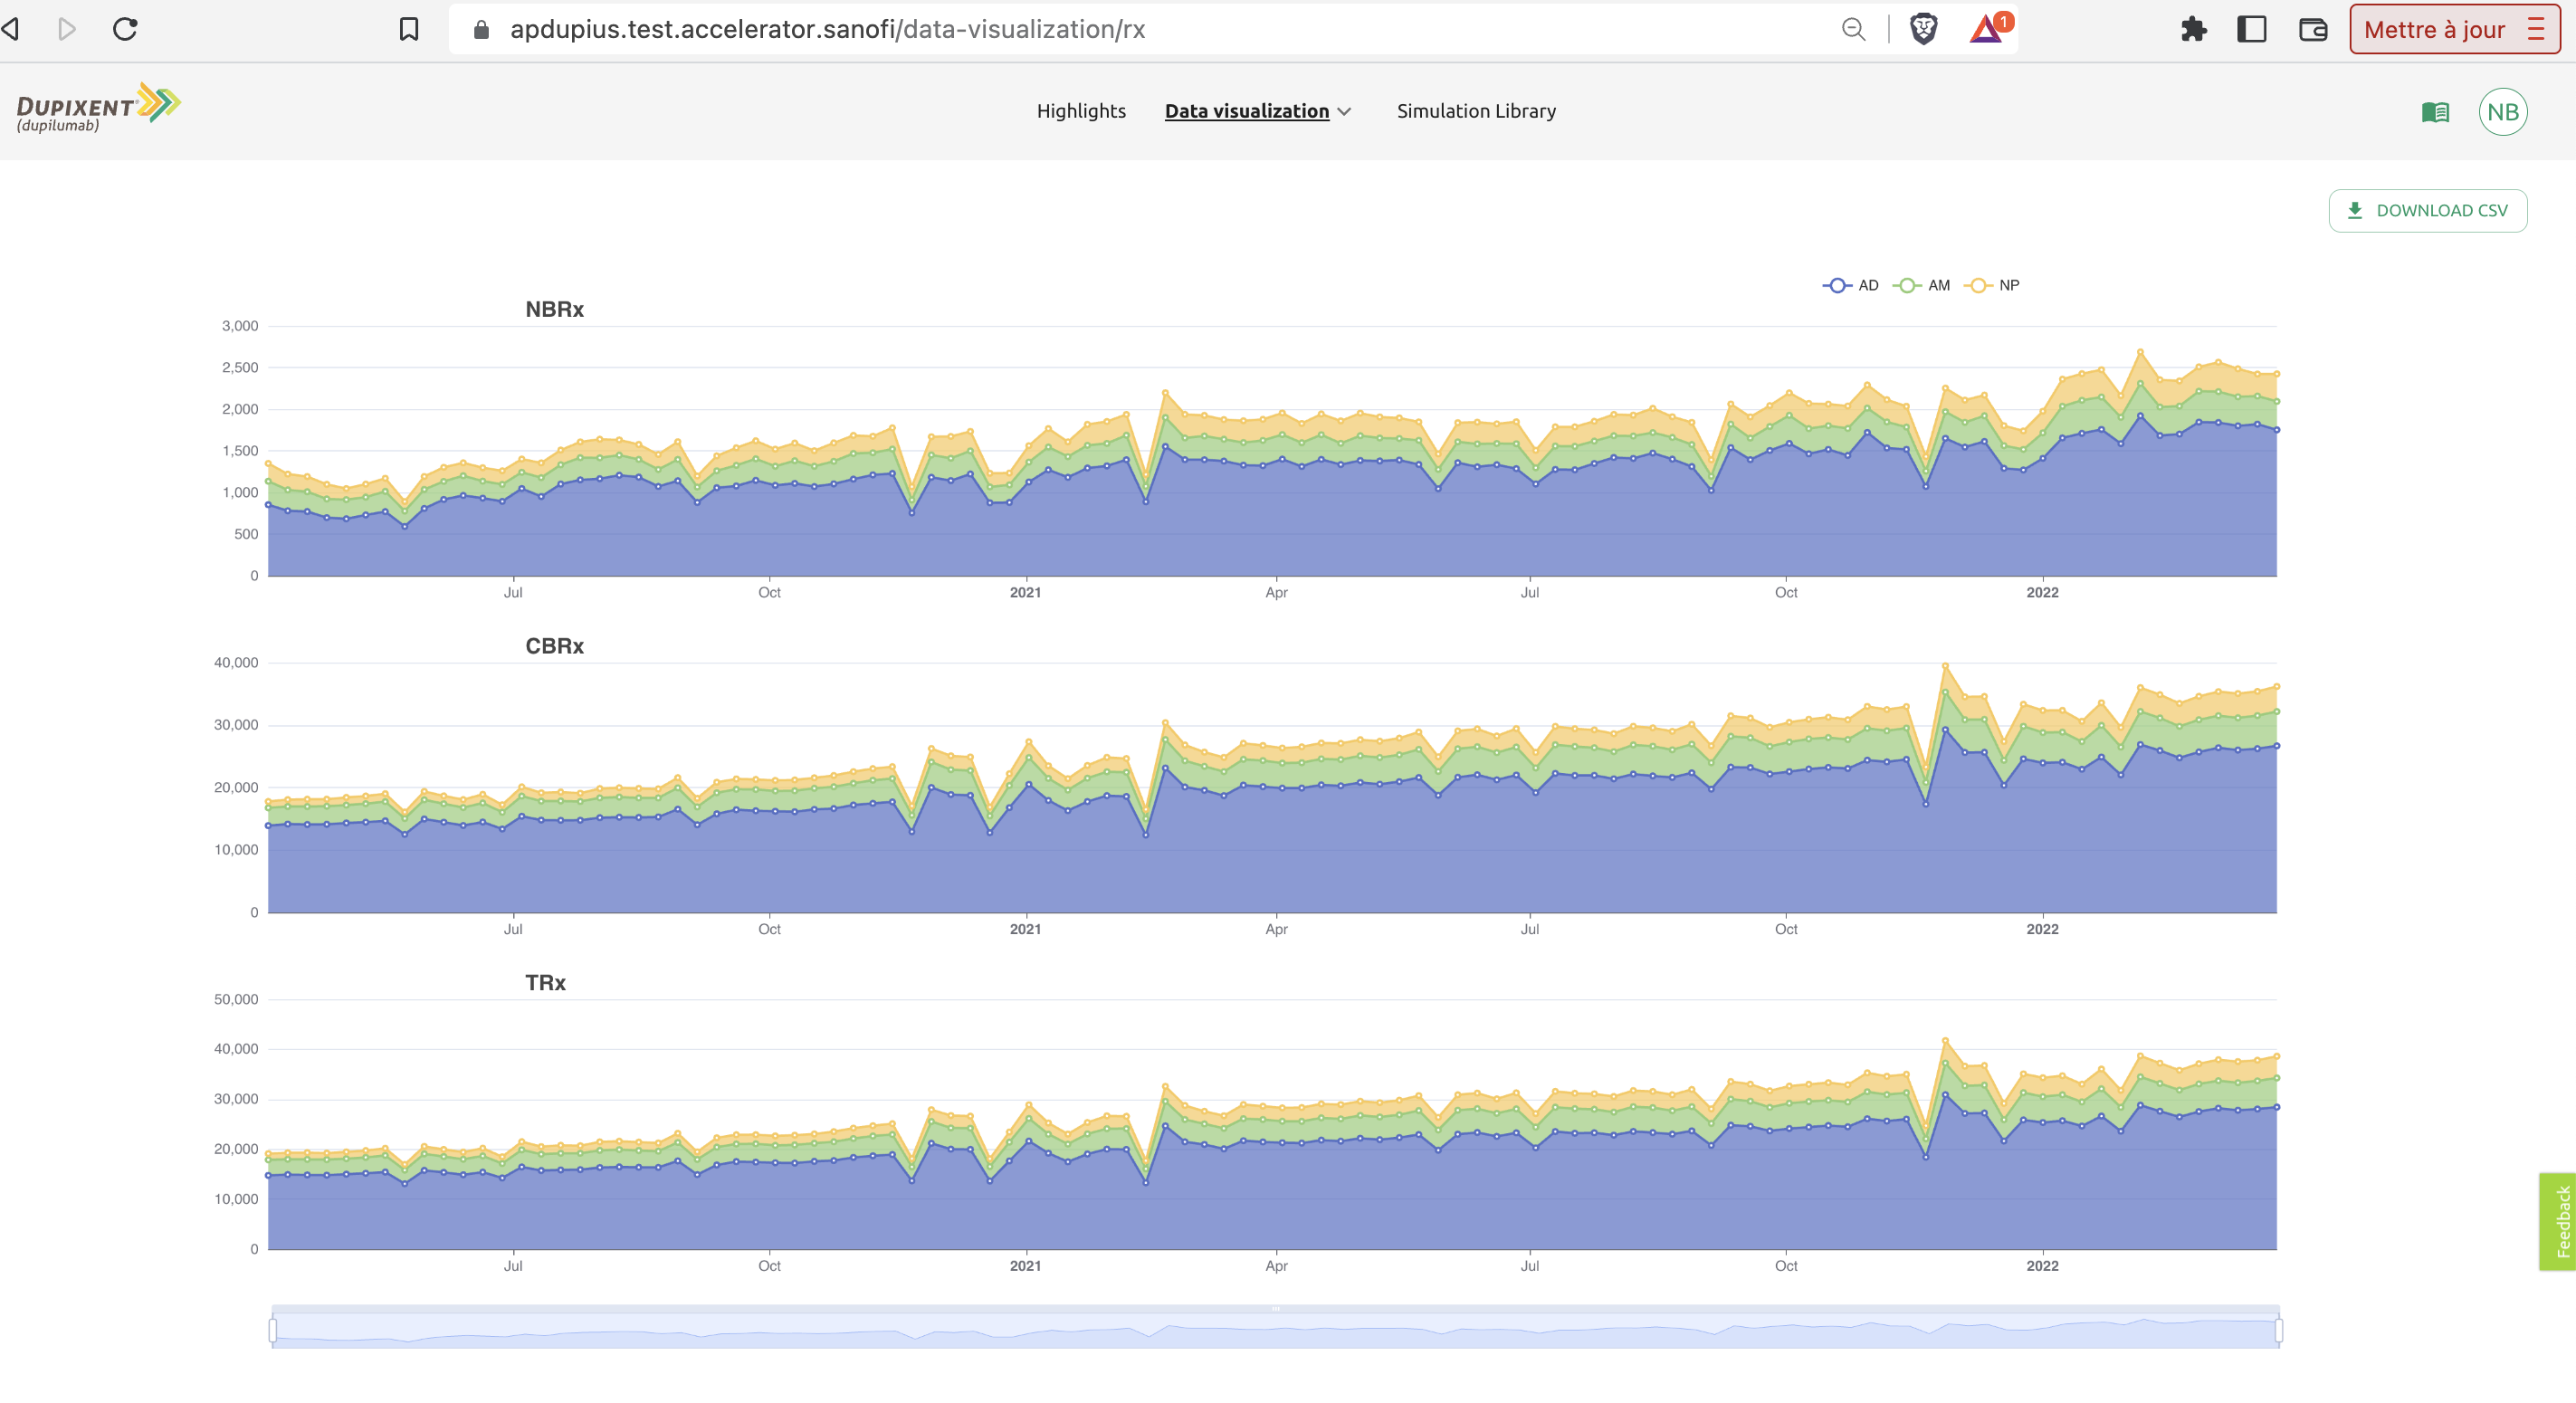
- Rx data visualization now includes NBRx at the bottom
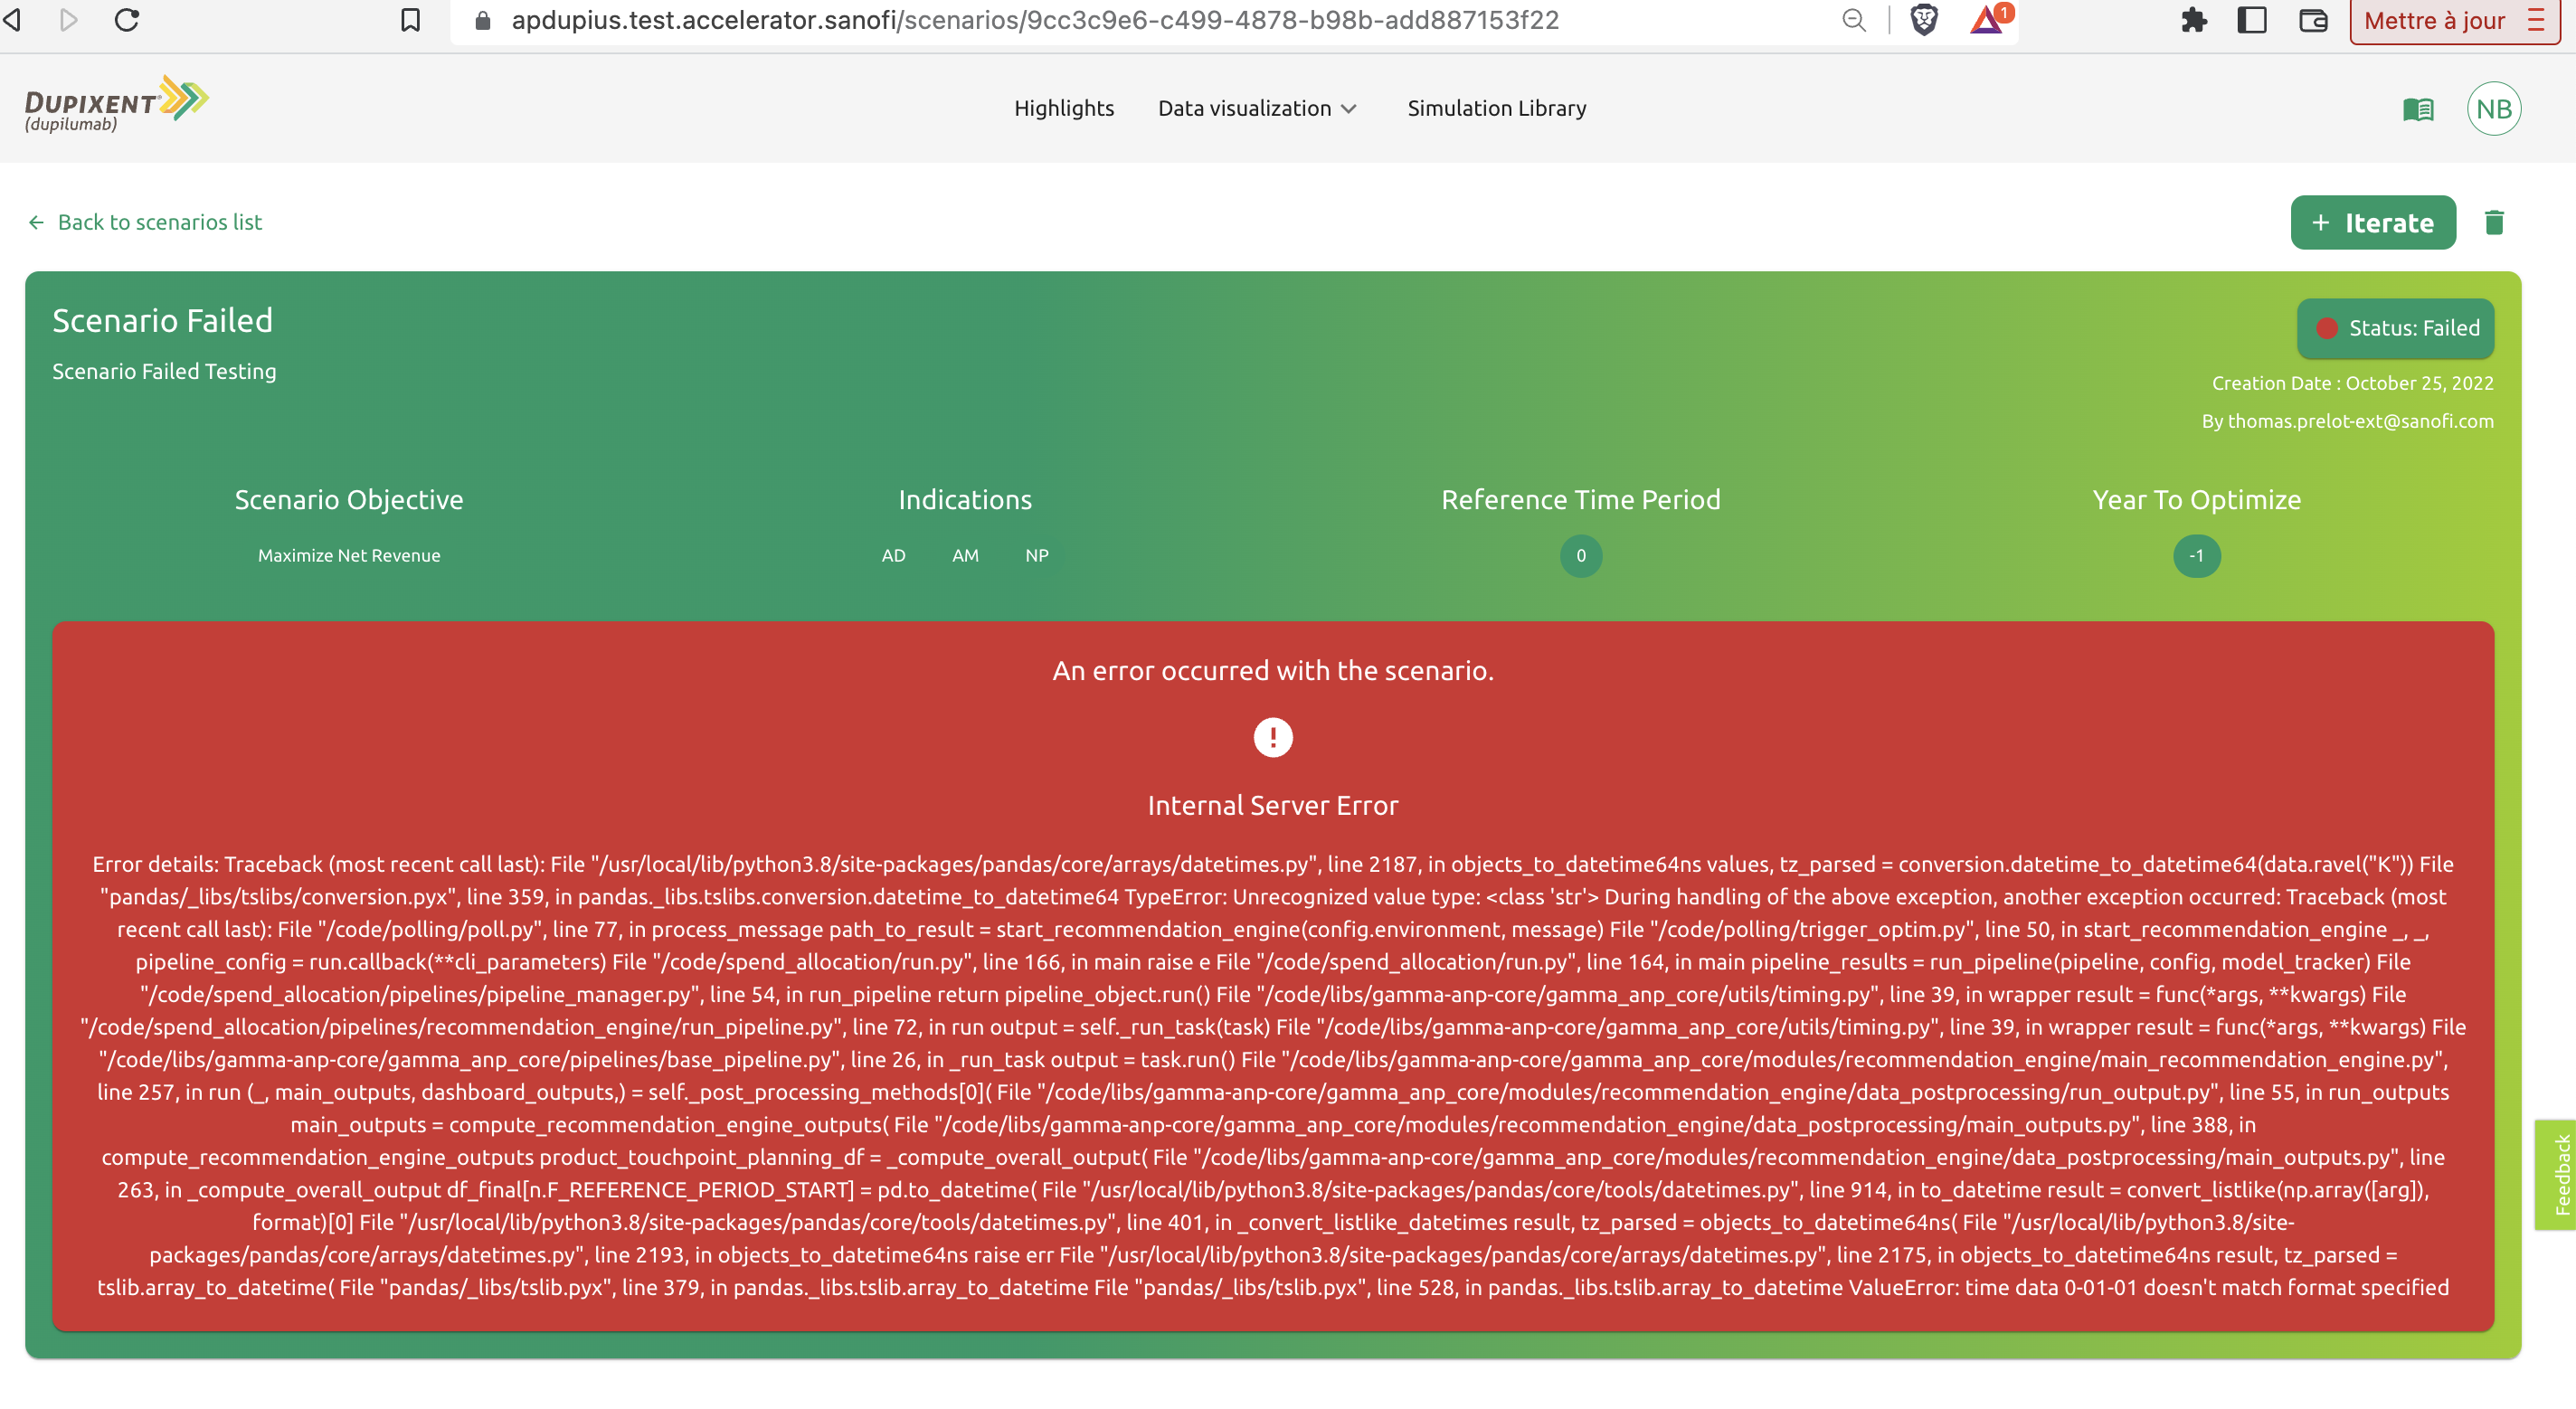
- Scenarios that have failed now provide the error that occurred for easier debugging
- Tactics execution data visualization are provided with by default a start date set to Jan 1st 2021
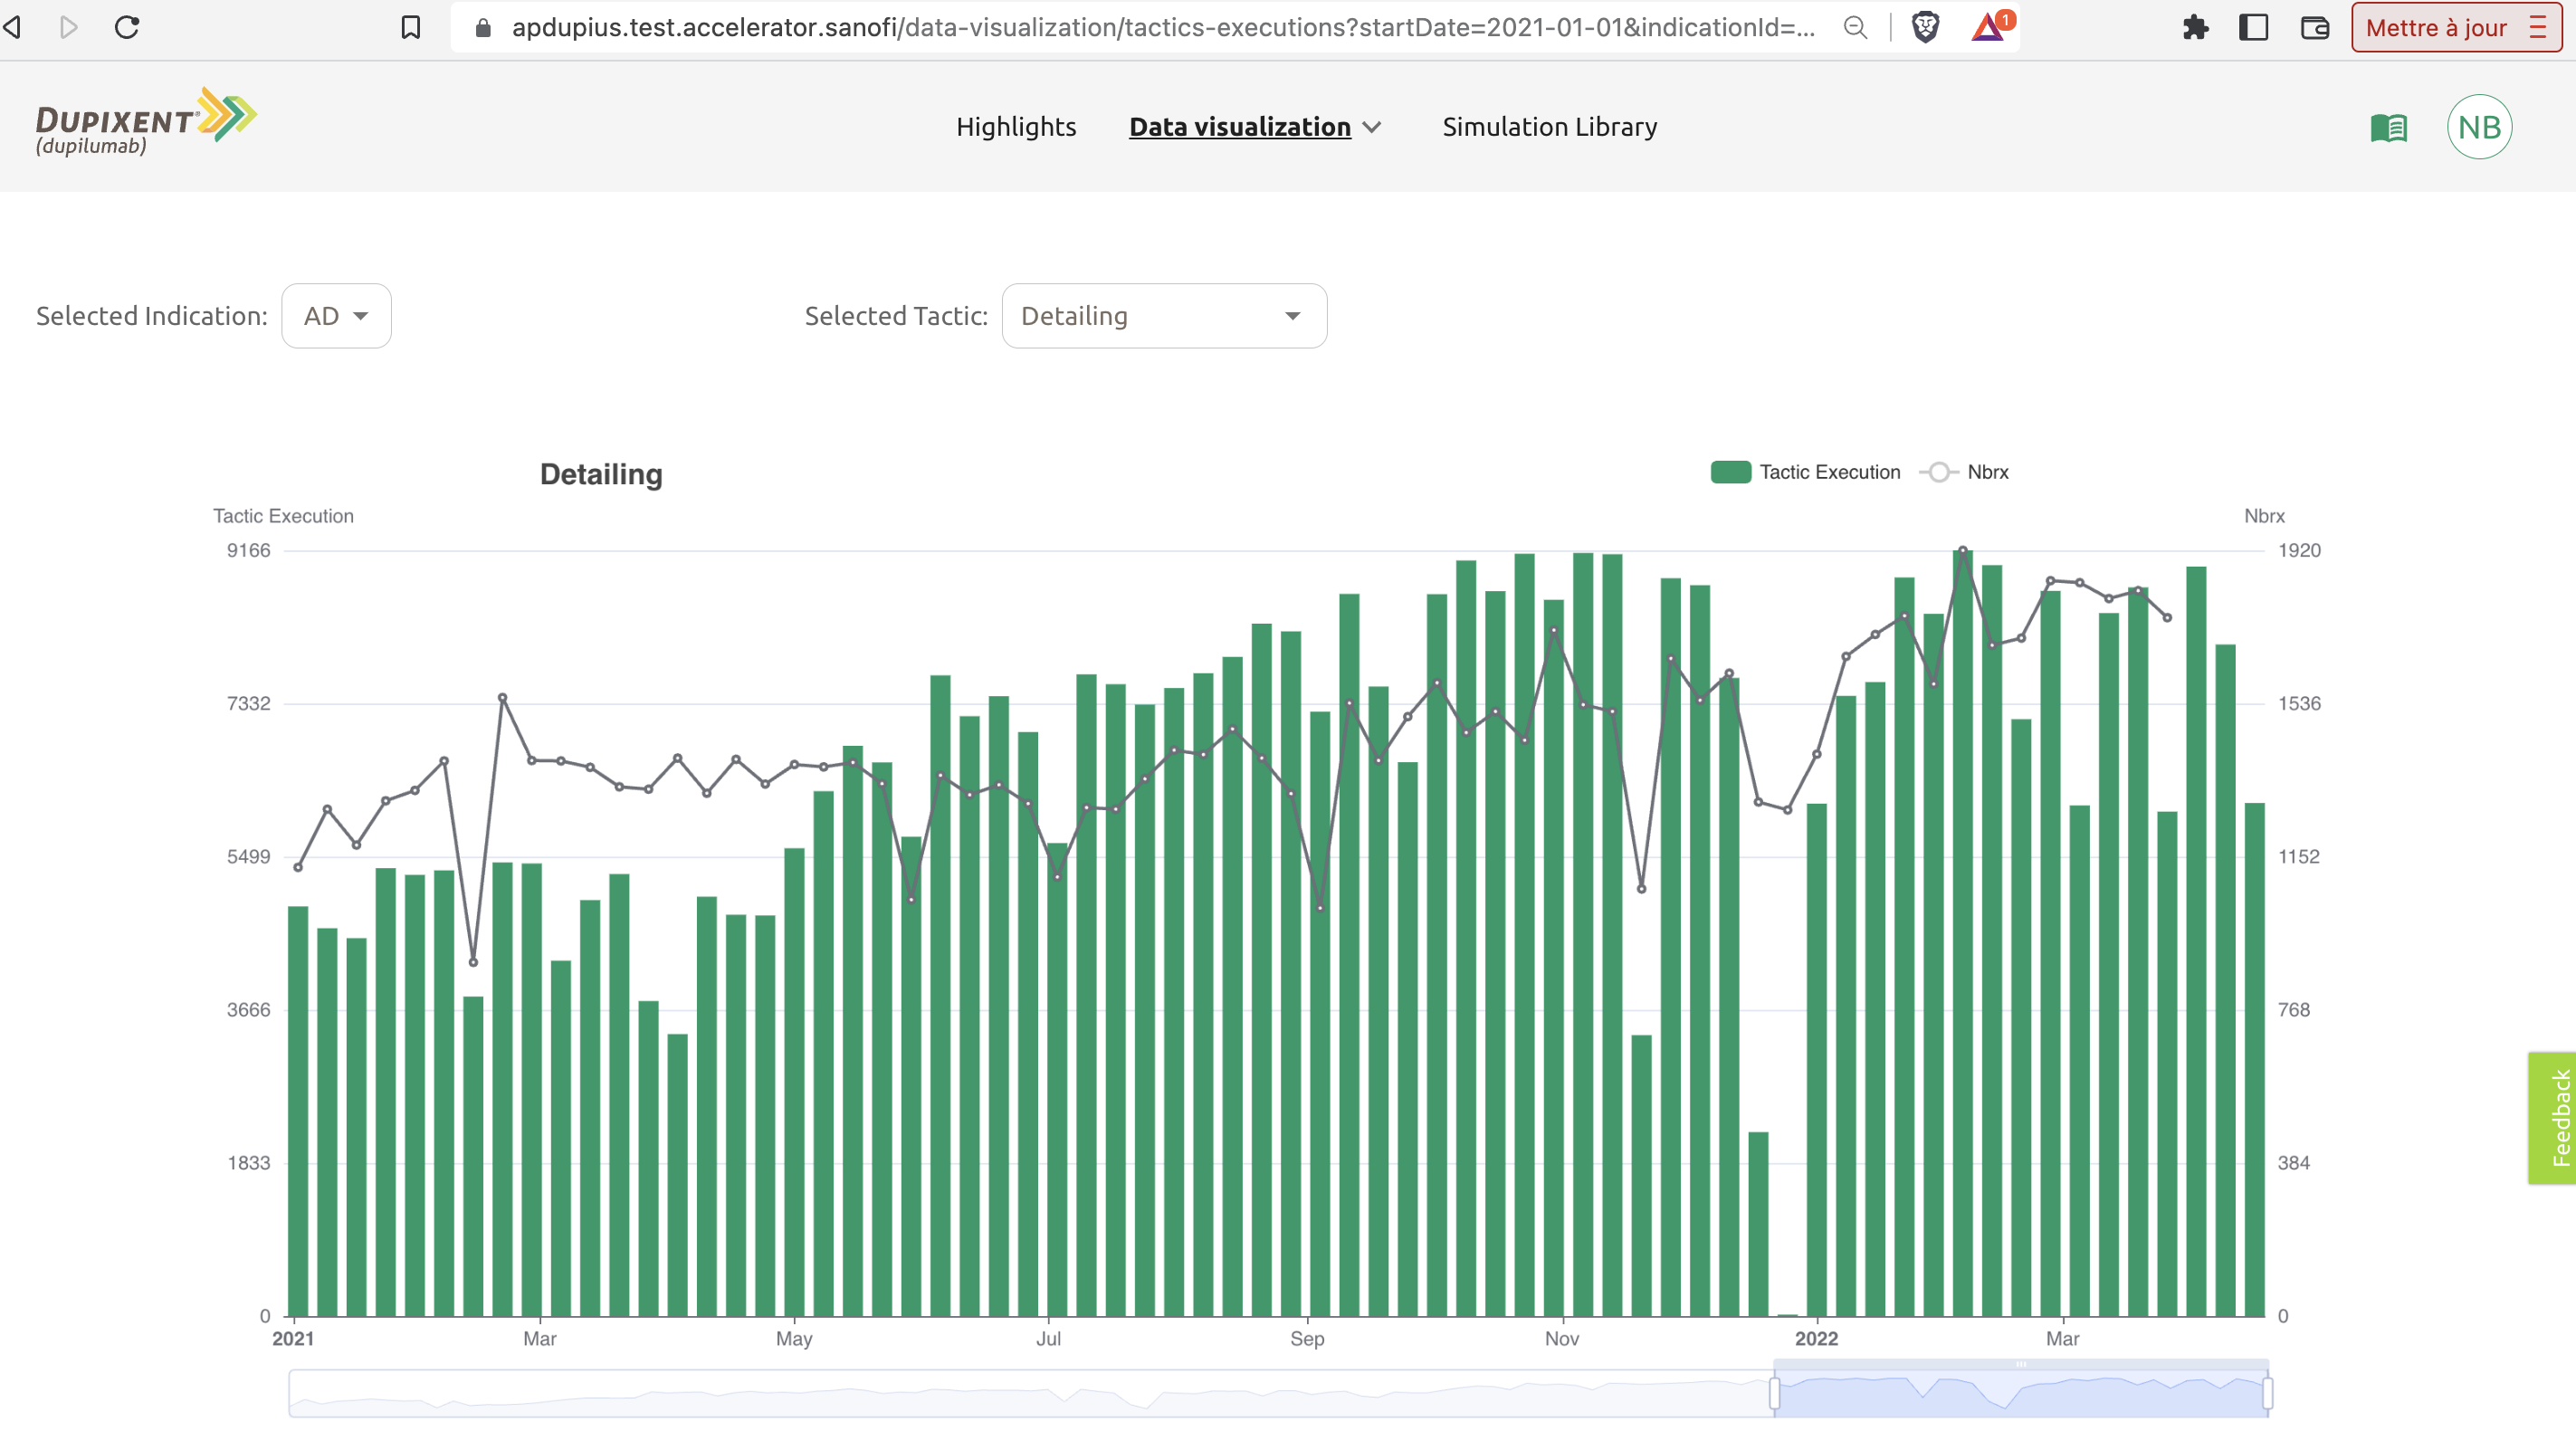
- Tactic execution visualisation for TV: an issue in the aggregation of TV data (sum instead of average) is now fixed
Technical additions
- End to end tests now run automatically to fend off regressions
- Launchdarkly has been installed to allow easy feature flipping
- Events can be "replayed", hence avoiding future needs to drop the database of scenarios