
Release Notes Sprint 13 (Dec. 7th 2022)
Many changes in this sprint, concerning the scenario results visualizations. The new features for this sprint are the following:
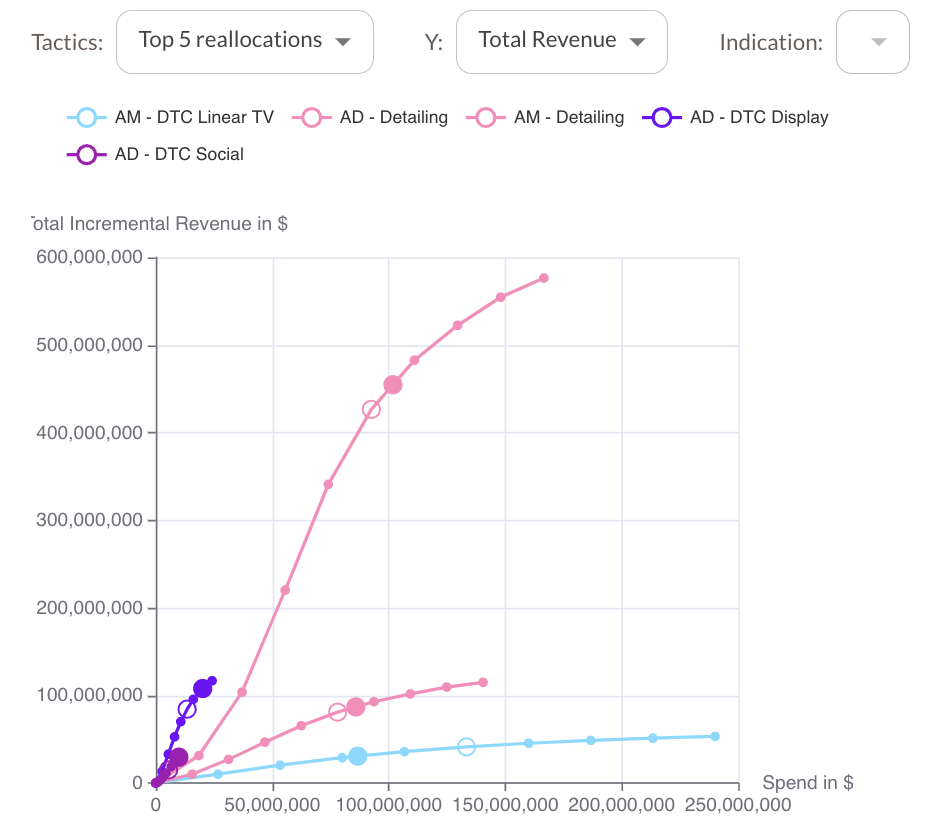
"Top 5" response curves
The Response Curves now show the top 5 changes in terms of spend, across all indications. This top 5 is the selection displayed by default.
Here, a theoretical example of unconstrained reallocation :
"Budget 2023" as a reference in the scenarios
The "Budget 2023" allocation is now the point of reference in the main KPIs in the header as well as on the response curves of a scenario
New main "delta" data visualizations in the scenario page
The scenario page now adds 4 data visualizations to the left of the response curves:
- variations in spend across indications
- variations of revenue across indications
- variations of spend across tactic categories
- variations of revenue across tactic categories
Also, the response curves are now displayed to the right of those "delta" data visualizations. Interactivity between those components is planned in future evolutions
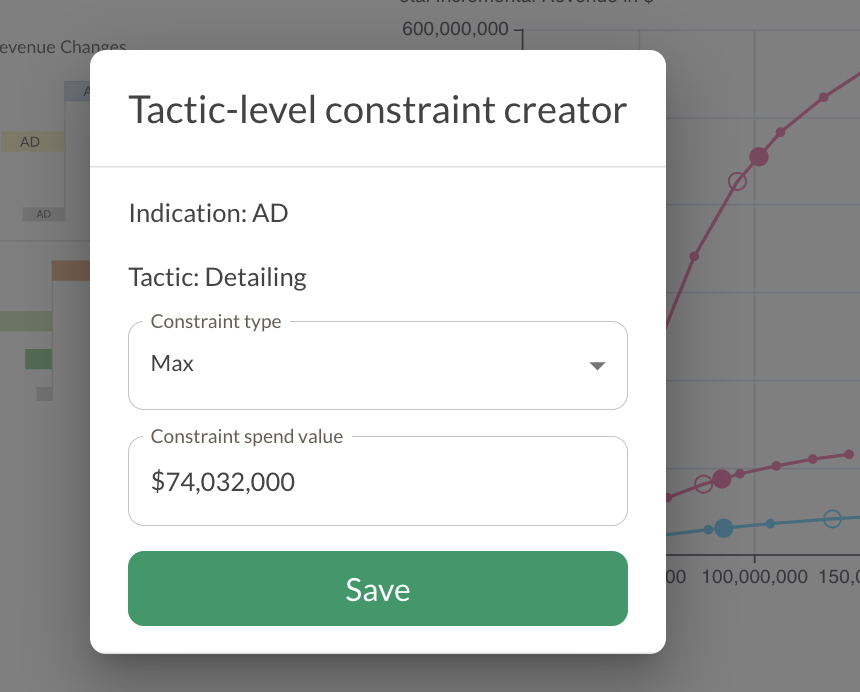
Improvement of the format for values constraints set on the response curves
The format of the field used to input value constraints on the response curves is now improved
Coming soon - New "heatmap" result table
The results are now presented in an extra table presenting all changes in terms of spend, for all indications and all tactics, with scales of blue for negative changes and scales of green for positive values. The development is almost finalized: this addition is going to be made available later this week.
Other changes will be added in the future (NBRx, Revenue, ...)